Your service business, live and traceable.
A live financial view over your service operation — WIP, parts, labour, margin, warranty and contract profitability — where every number is current and every number decomposes to the transaction behind it. Three personas, one event-sourced graph.
Illustrative figures
Your service P&L arrives late, and no one can trace it.
The service margin number lands weeks after the work is done, stitched together from the ERP, a warranty spreadsheet, a parts system and a few exports. By the time anyone sees it, the losing contract has renewed and the recoverable warranty has been written off.
And when someone asks “why is margin down on this account?”, the honest answer is a week of reconciliation — because no single number can be opened up to the transactions that made it.
One graph. Three lenses. Every number traceable.
Your operational systems — work order, CPQ, order hub, warranty, asset health — emit canonical events. A single event-sourced graph assembles them into a live financial picture, and three personas each read it their own way: the service manager sees jobs, the VP sees leakage, finance sees true margin and cost.
Not a rip-and-replace. Not another ledger. A lens over what you already run.
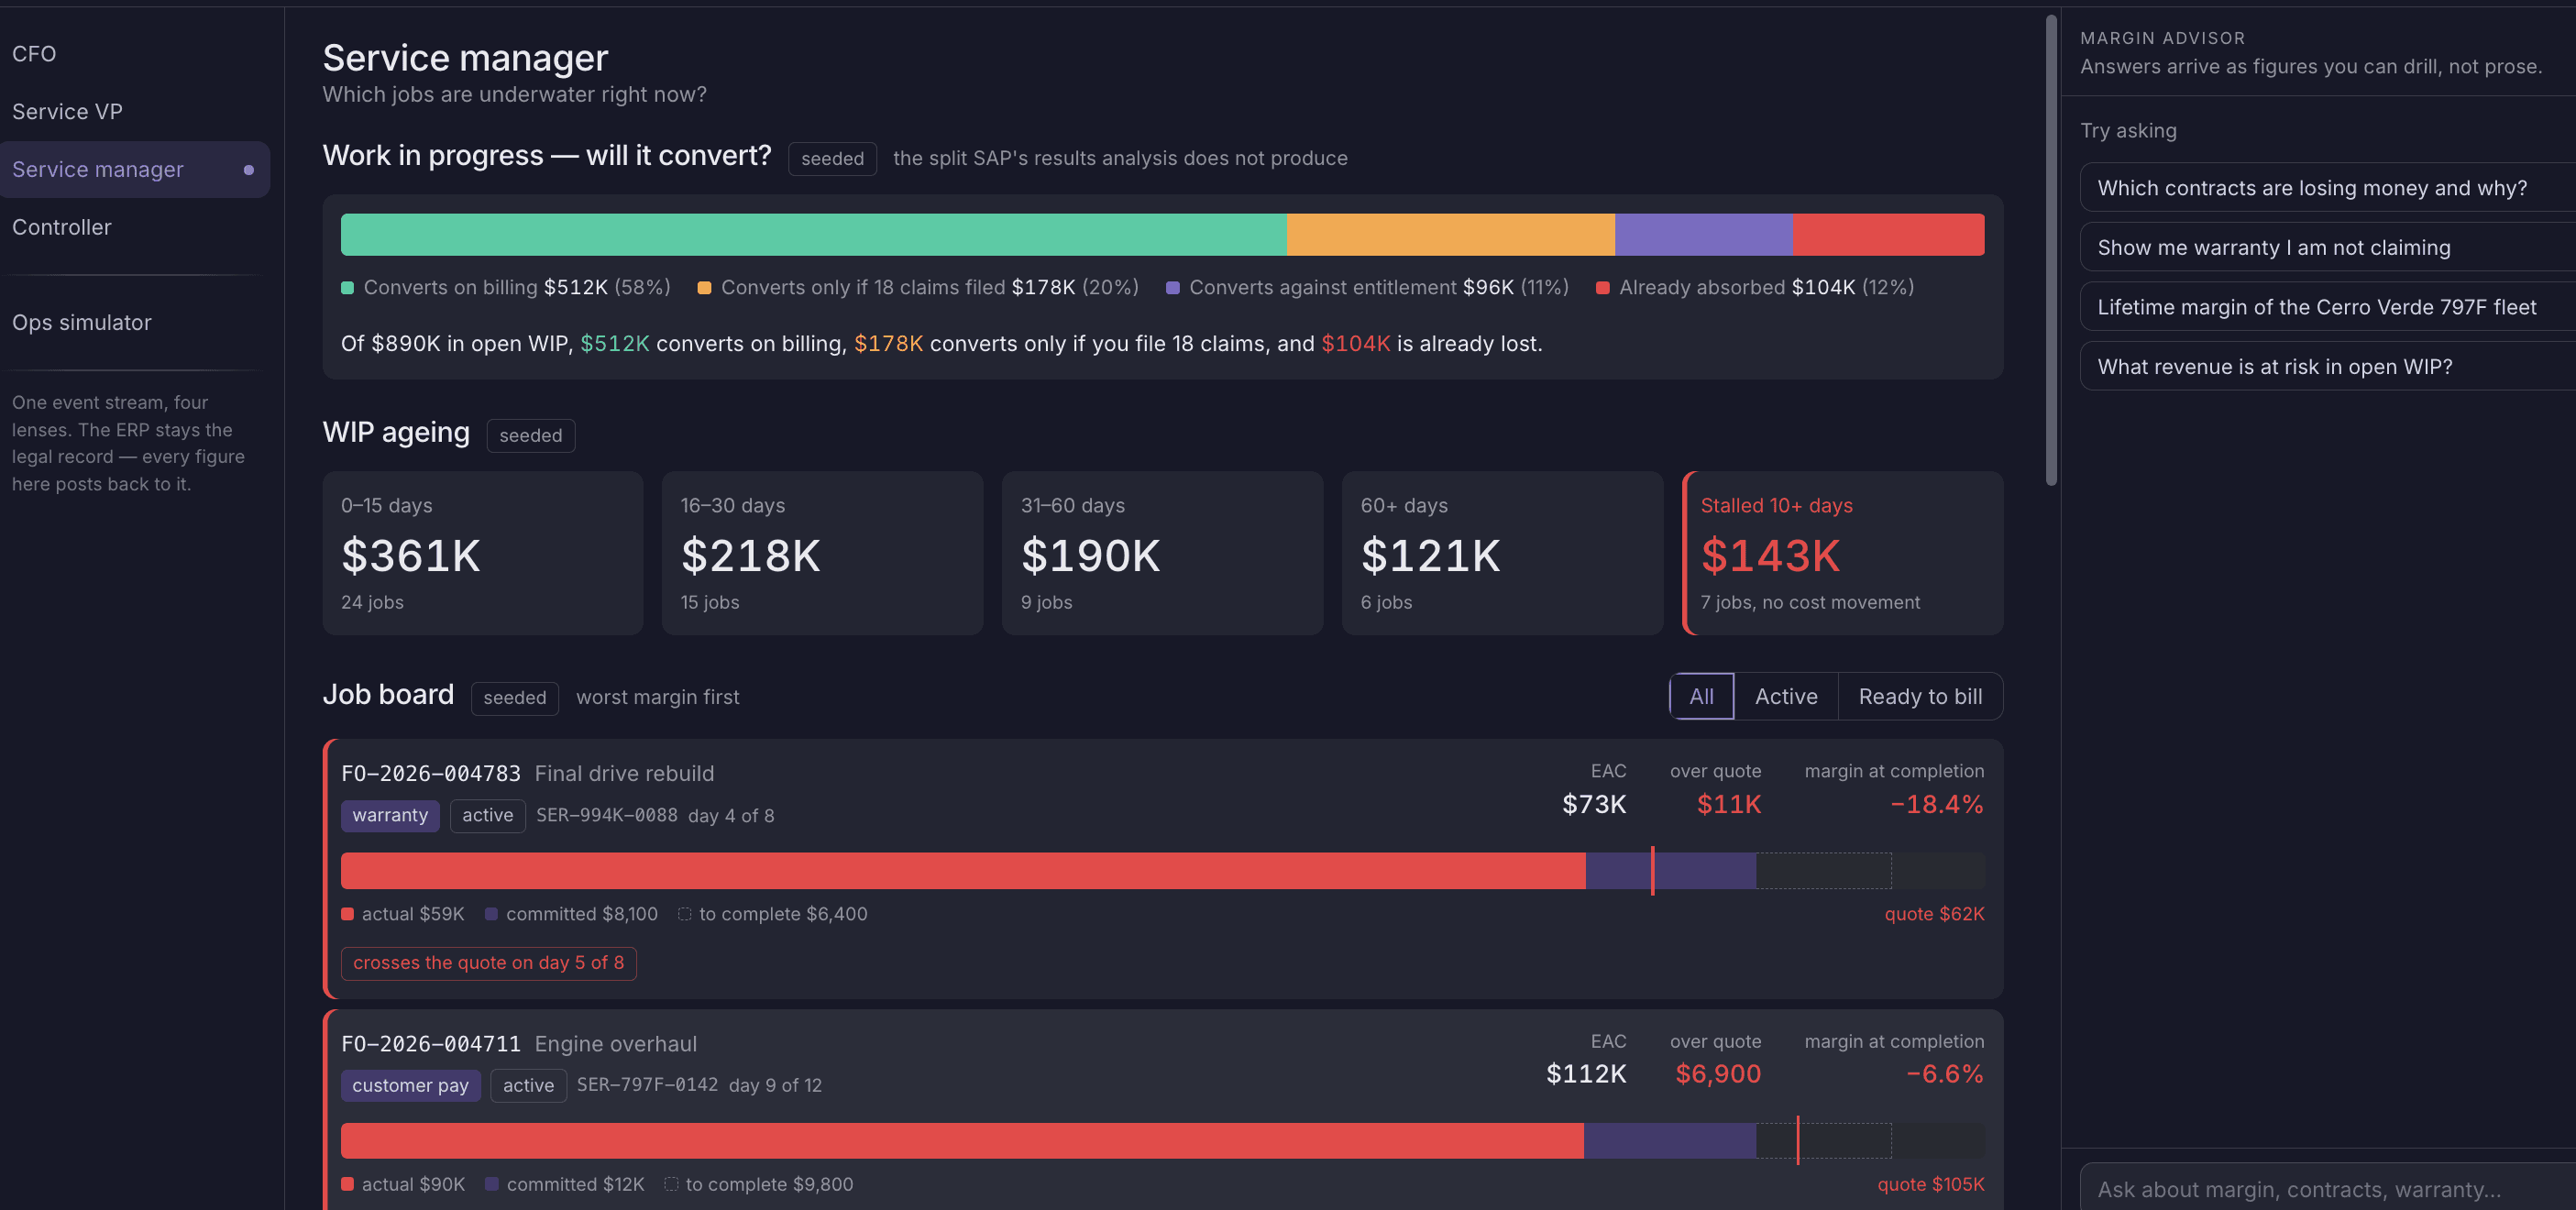
“Are my jobs on track?”
The floor-level lens: work-in-progress by job, what will convert to a bill, what’s ageing, and the true cost of parts and labour as the work happens — not reconstructed at month-end.
Work-in-progress value per job, live — what's booked, what's billable and what's stuck ageing.
Parts consumed and forecast per job, costed against the plan instead of discovered at close.
Labour hours and parts roll into true job cost as the work happens, not weeks later.
“For the first time a supervisor can see which jobs are quietly turning into losses while they can still do something about it.”
“Where is money leaking?”
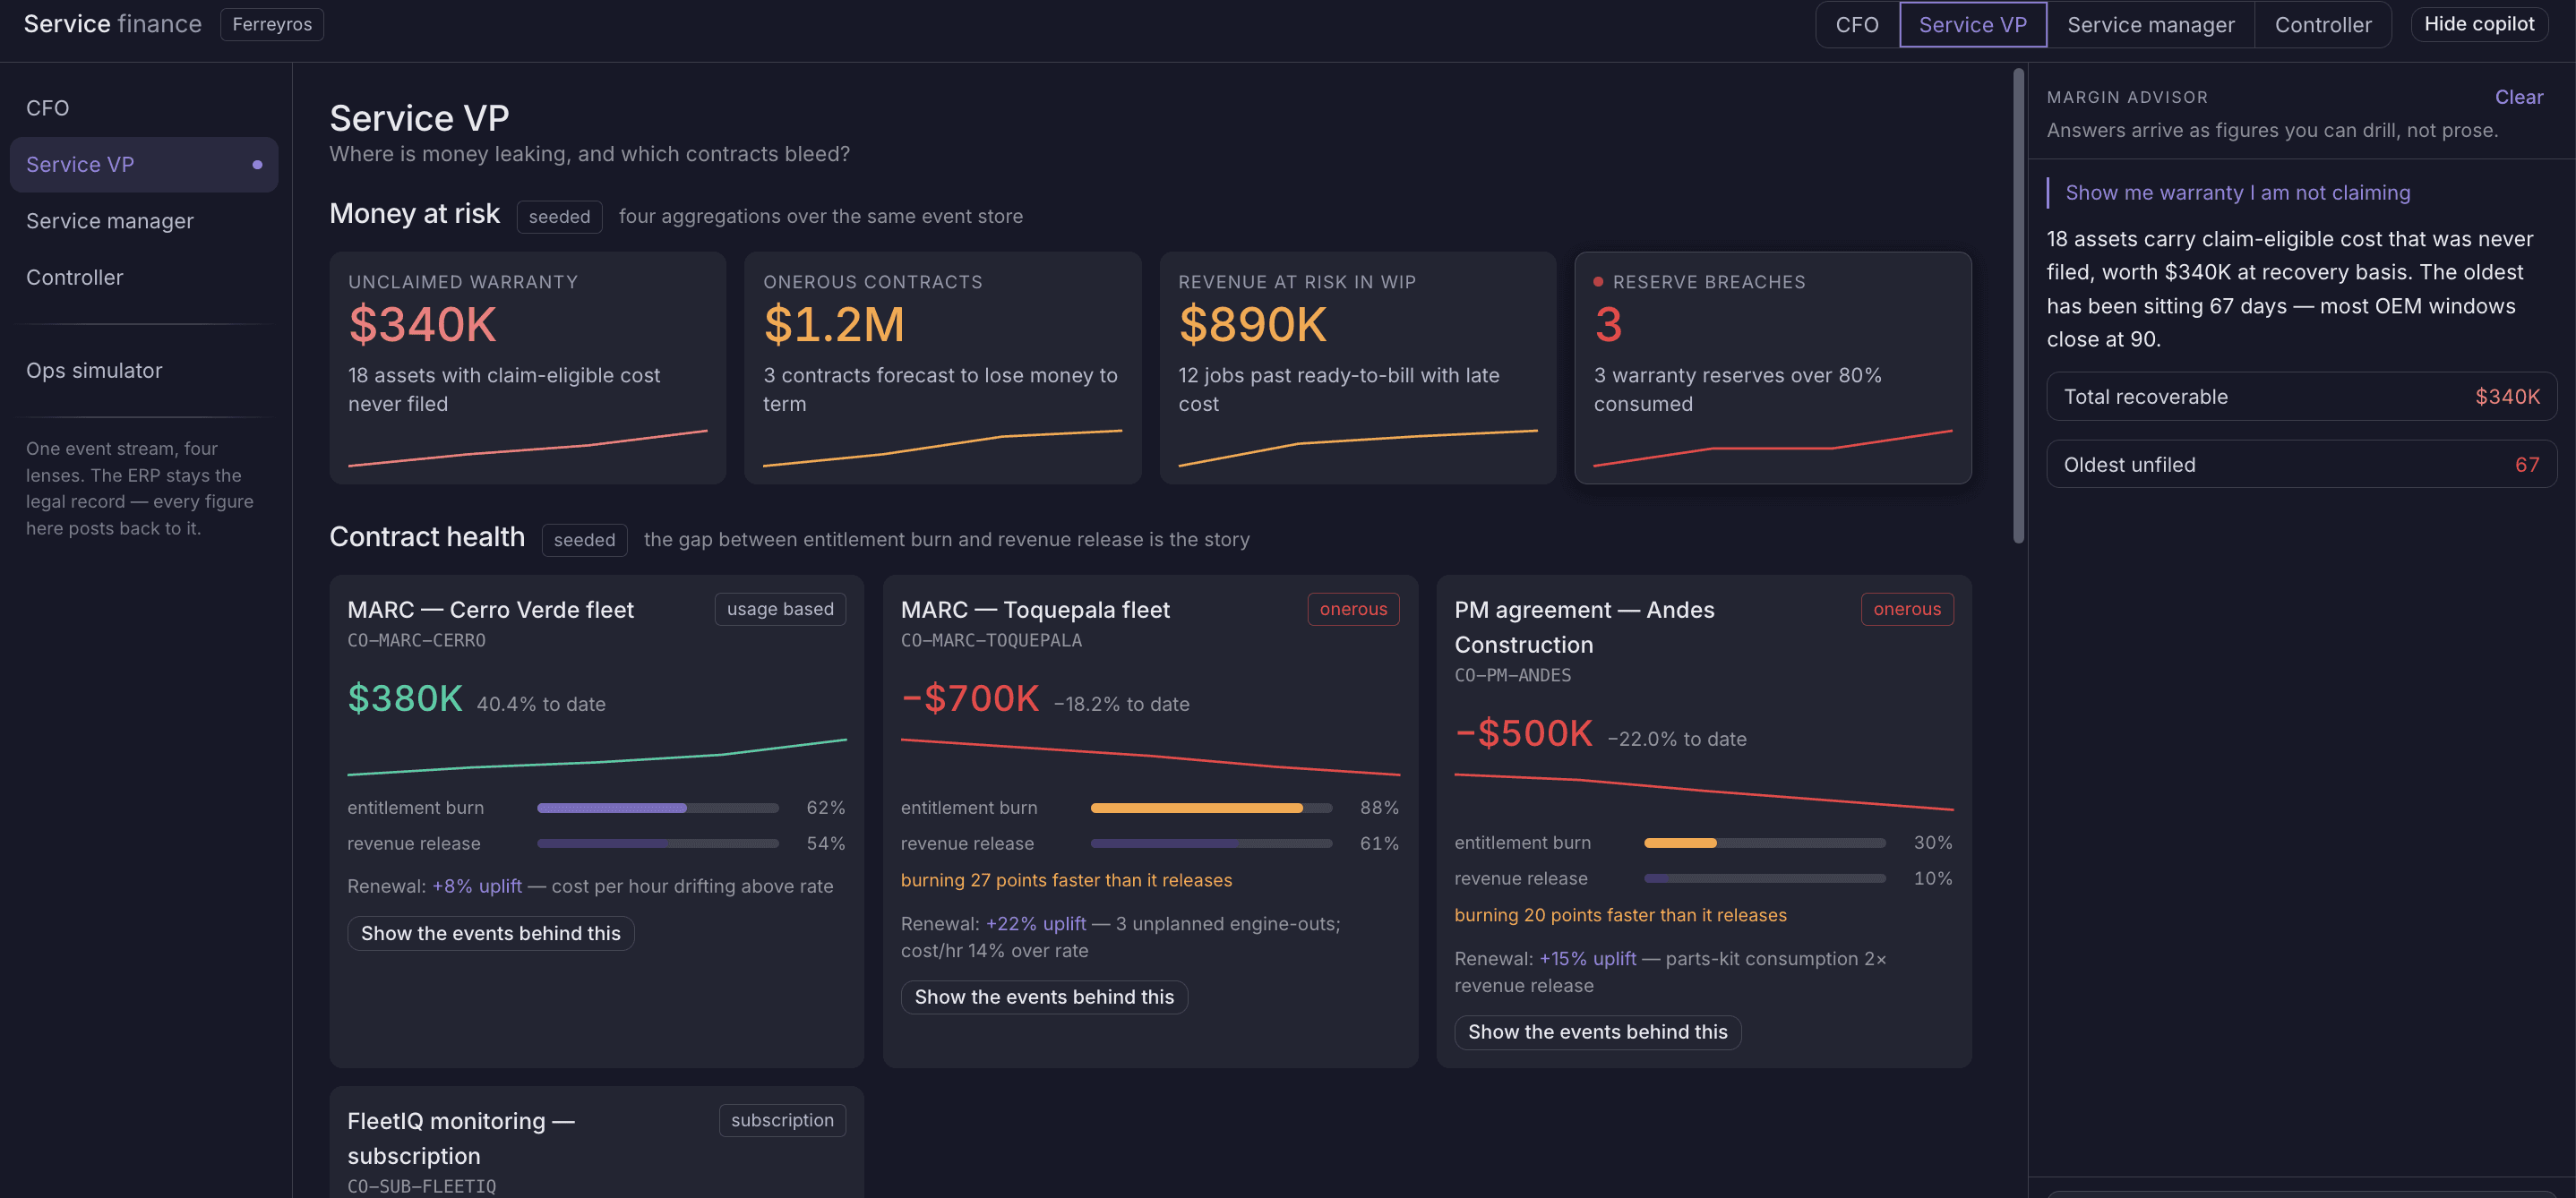
The portfolio lens: contract profitability ranked, warranty and supplier leakage surfaced before it’s written off, and a margin advisor you can simply ask where the money is going.
Every service contract ranked by margin — which ones earn, which ones quietly bleed.
Recoverable warranty and supplier cost surfaced before it's silently written off.
A natural-language margin advisor — ask where money is leaking and get the traversal, not a ticket.
“What’s my true margin and cost?”
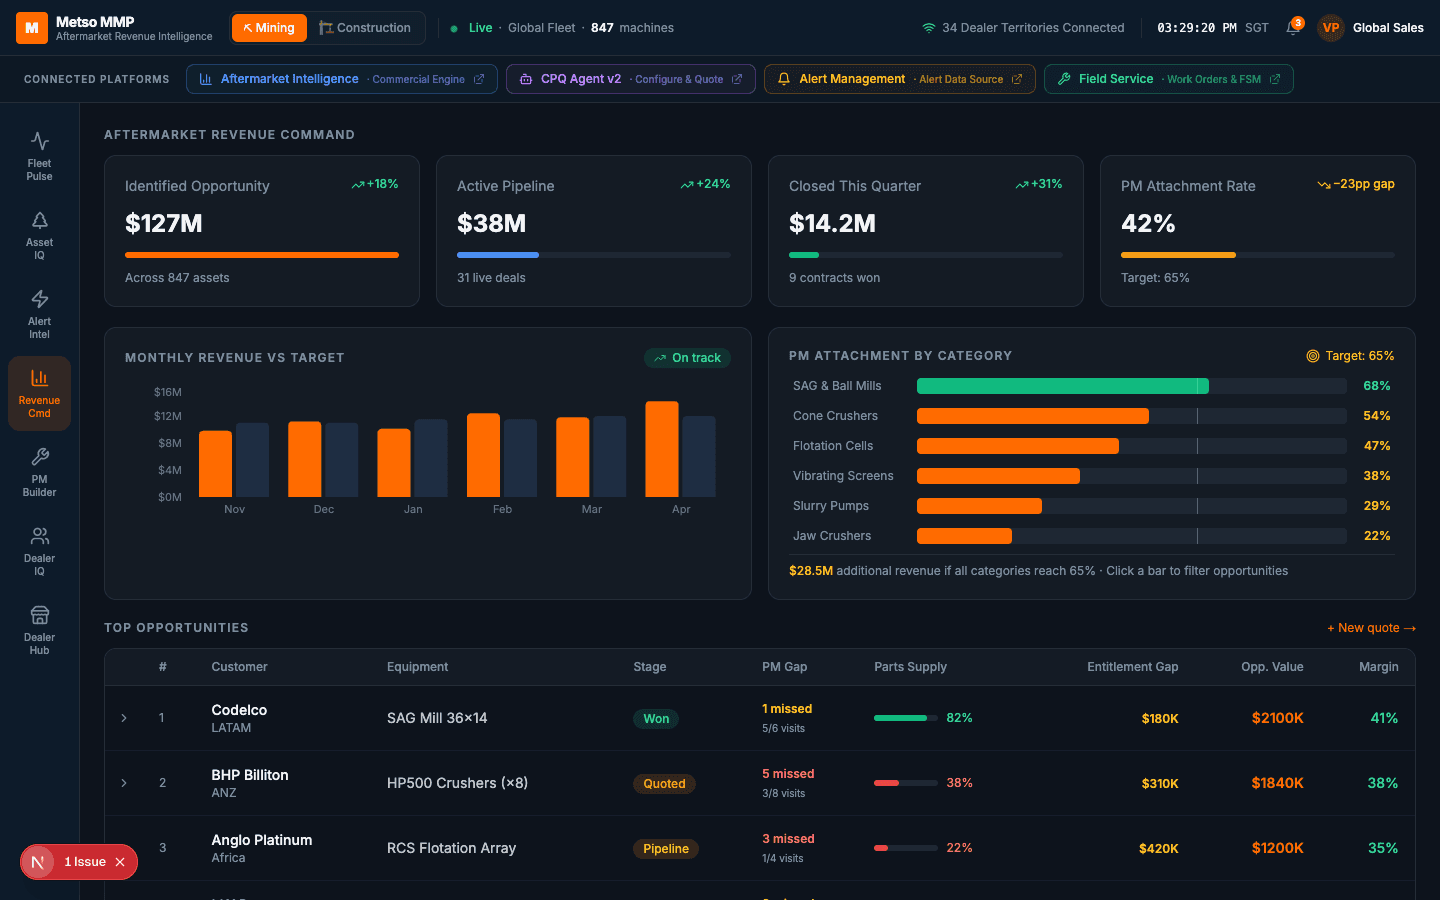
The controller’s lens: service P&L with a margin waterfall, COGS matched to the revenue that earned it, and exposure — every figure decomposing to the transactions beneath it for the close and for audit.
Revenue, cost and margin per asset across its entire service life, not just this quarter.
Parts and labour cost matched to the exact revenue event that earned it.
Every number opens to the transactions beneath it — ready for audit and the close.
Every number decomposes to the transaction.
A dashboard shows you a total. This shows you the total and the exact events that made it — the parts consumed, the hours logged, the warranty claimed, the invoice raised — because the number is a traversal, not a stored figure.
That’s the difference between a report you have to trust and a number you can prove.
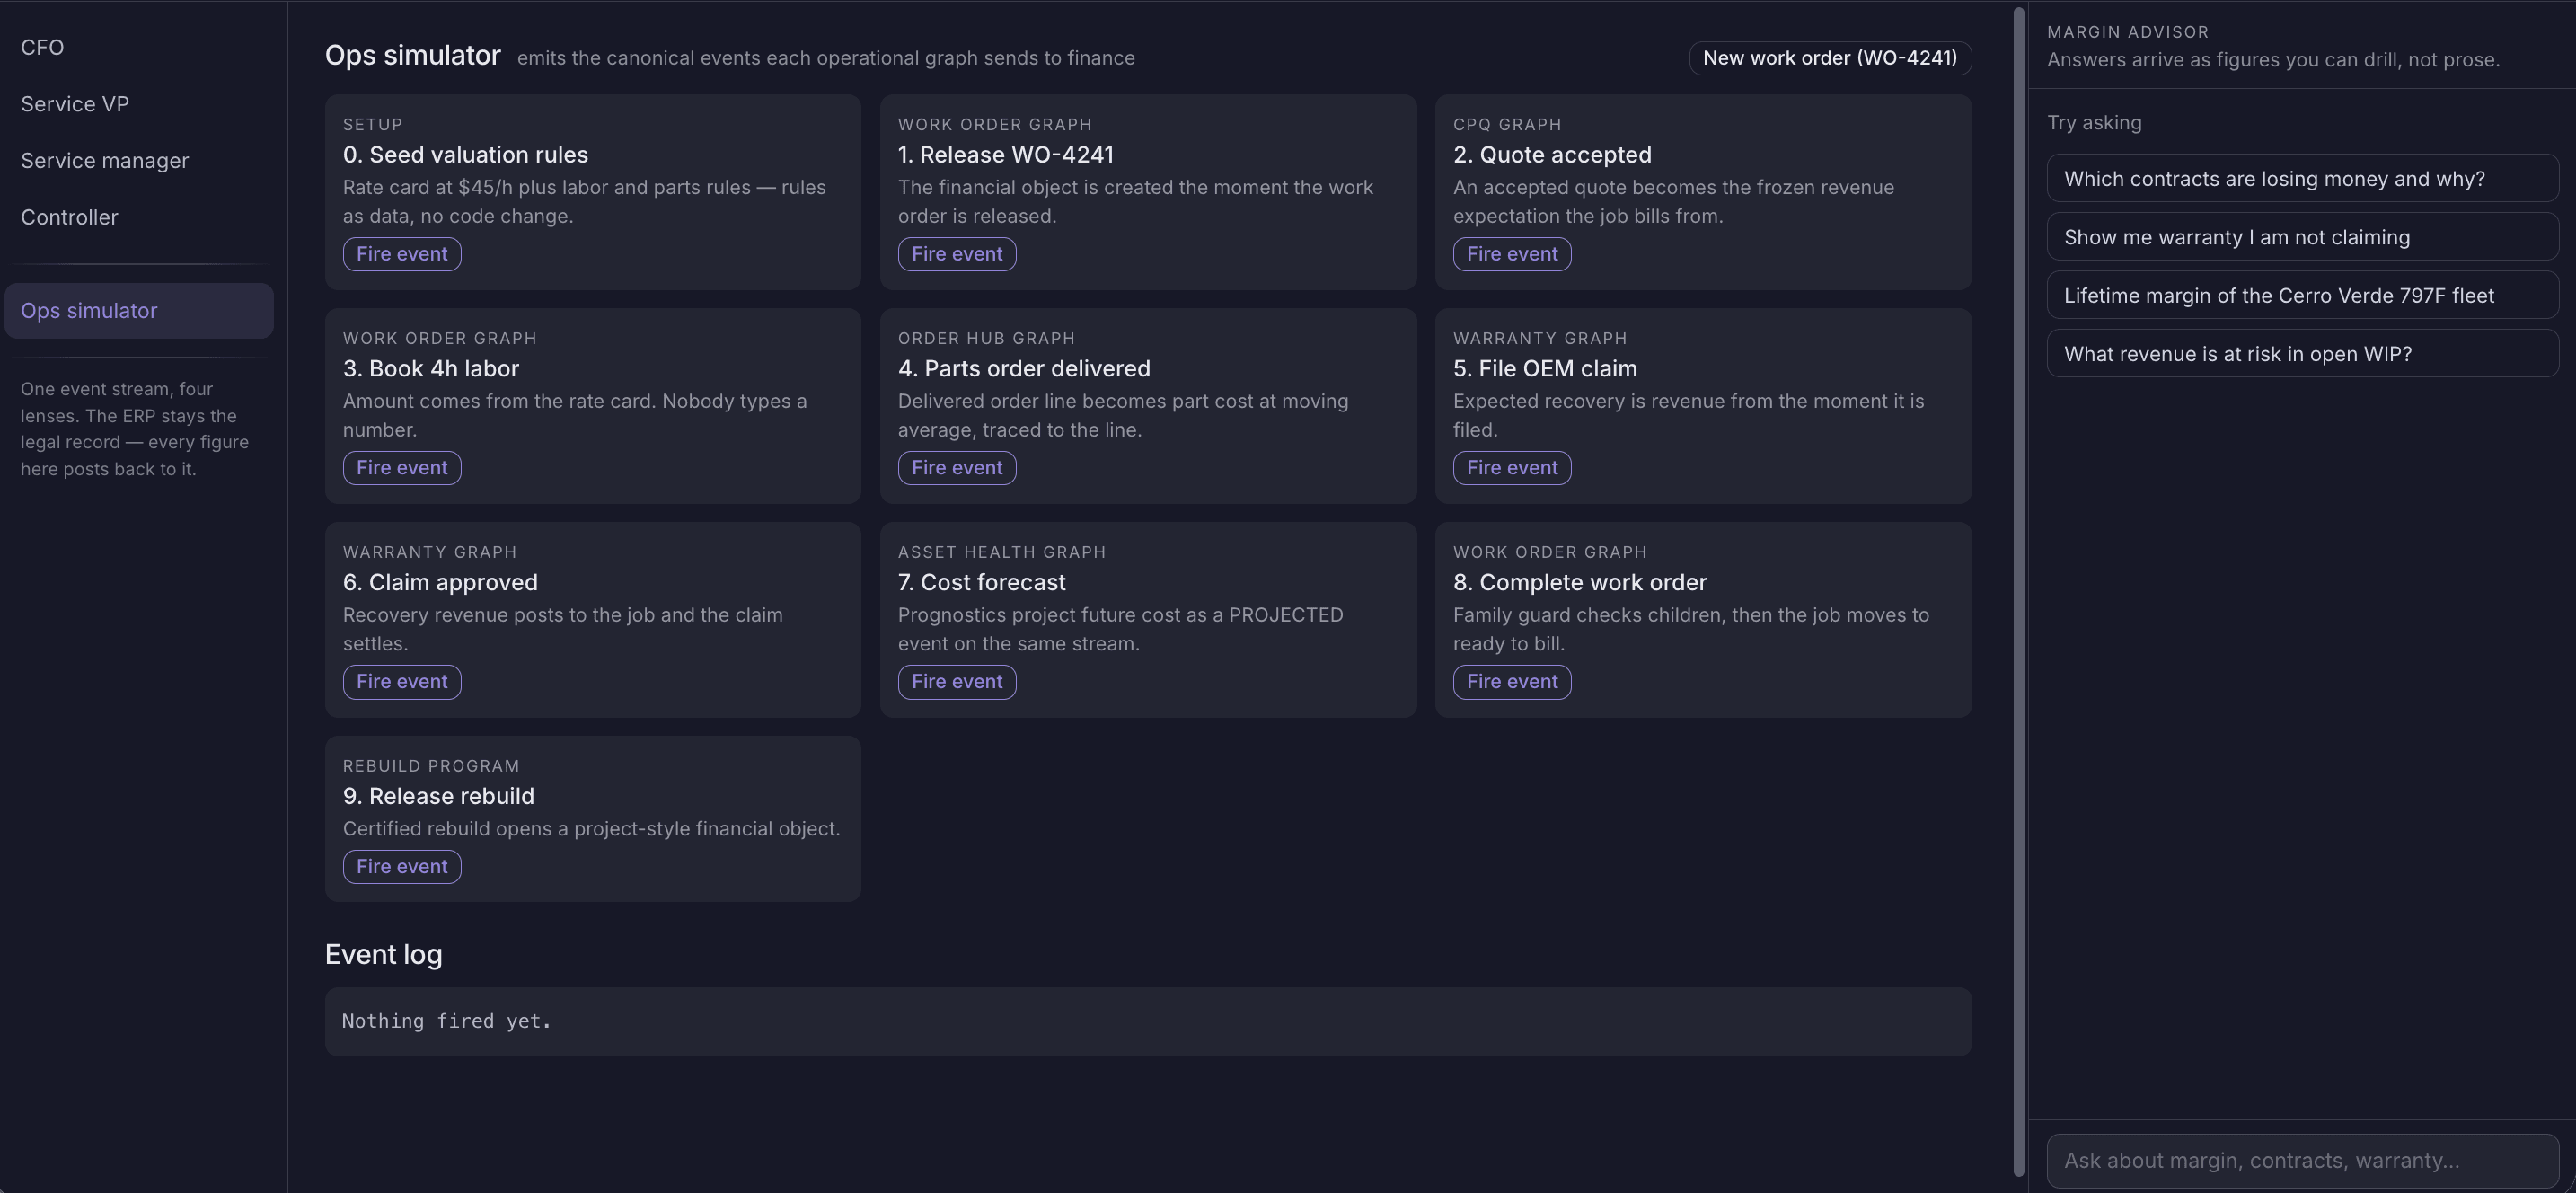
The canonical events every operational graph sends to finance.
Work order, CPQ, order hub, warranty, asset health and rebuild programs each emit a small, canonical set of events. The finance graph subscribes to them — nothing is re-entered, and the trail is the source of every figure.
A layer over your ERP, not a replacement.
Agents and apps read through a knowledge API into one event-sourced graph, which sits across your business services and the ERP that remains your ledger of record.
Cross-domain questions become one traversal.
“Which contracts are losing money because of warranty repairs we never recovered?” touches contracts, work orders, warranty and parts. In a stack of separate systems that’s a data project. On one graph it’s a single traversal — which is why the answer is live instead of a quarter late.
What you get in the first weeks, on one subgraph.
Surface warranty and supplier cost that would otherwise be written off, with the evidence attached.
See which contracts bleed margin while there's still time to reprice or walk away.
Know what's booked, billable and stuck across every open job — live, not at month-end.
Managers, VPs and finance each get their own lens without waiting on a BI request.
Every figure decomposes to its transactions, so finance can stand behind the number.
You don’t boil the ocean. Start with one subgraph — usually warranty leakage or contract profitability — prove the number, then let each additional graph compound on the same foundation.
Common questions
A live, traceable financial view over your service business — WIP, parts, labour, margin, warranty and contract profitability — built on an event-sourced graph rather than a nightly report. Every number is current and every number decomposes to the transaction that produced it.
No. The ERP stays the ledger of record. This is a layer over it: operational graphs (work order, CPQ, order hub, warranty, asset health) emit canonical events, the graph assembles them into a financial view, and postings still settle in your ERP. It's a lens over what you already run, not another ledger.
Because the financial view is event-sourced. A margin figure isn't a stored total — it's a traversal over the events that created it (parts consumed, labour logged, warranty claimed, invoice raised). Open any number and you see the underlying events, which is what makes it audit-grade.
Warranty leakage is recoverable cost — supplier back-charges, in-warranty repairs billed as paid work — that gets written off because no one connected the repair to the entitlement in time. The graph surfaces it against the exact machine and claim, so it can be recovered instead of lost.
You start with one subgraph — often warranty leakage or contract profitability — rather than a platform migration. Because it reads events from systems you already run, the first lens can be live in weeks, and each additional graph compounds on the same foundation.
See your service margin, live and traceable.
Book a live walkthrough and we'll trace a real number — WIP, warranty or contract margin — back to the events that made it.